 WellPlot 4 is now available for Mac OS X Intel and PPC Macs! WellPlot 4 is now available for Mac OS X Intel and PPC Macs!
WellPlot 4 is a stratigraphic data analysis and charting application
that plots multiple categories (up to 600 columns) against depth or sequence
of samples. It reads data directly from spreadsheets. Sums, percentage
and concentration data may be calculated and saved. Plot types include:
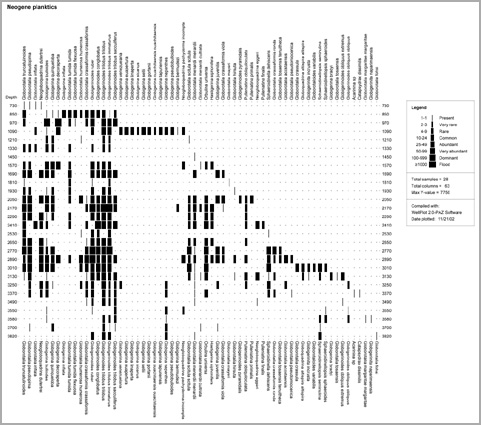
multi-track x-y line plots (log style), butterfly diagrams, bar charts
(log style), interval histogram range charts, range-through charts, percent
events plots and cumulative data plots with 1st derivative. The Y-axis
(depth) can be scaled to depth or sequential samples. The X-axis can be
normal (arithmetic) or LOG scale, and absolute or normalized. Exaggeration
may be applied to low abundance groups. The charts can be scaled to any
horizontal and vertical dimensions. Wall-size charts to page-size charts.
Sort categories by first occurrence, last occurrence, alphabetically, by
maxima, by species codes or as originally entered. Find common groups of taxa by name or databased information code. Use WellPlot to plot many other types of well data
such geochemical or petrological.
System requirements: Mac OSX 10.6.8 or earlier.

Non-profit price: $500 USD. No upgrade path.
Non-profit pricing is extended to: Full-time (non-commercial) researchers at academic and research institutions.
For-profit price: $2000 USD.
For-profit upgrade price: $1500 USD.
For-profit pricing applies to: Corporations, employees of corporations and consultants.
How to order
Pierre A. Zippi
7518 Twin Oaks Court
Garland, Texas 75044
email: paz@pazsoftware.com
Some of the features:
• Plot up to 600 columns of data in side-by-side tracks in any single chart
• Numerous stratigraphic analysis features
• Read data directly from large spreadsheets (tab-delimited ASCII text format)
• Edit data directly within WellPlot (copy/paste to edit fields)
• Save percentage, concentration and summary data
• Save transfer functions from coded data for currently selected taxa
• Calculate concentration data for pollen diagrams. Save it as a new data file
• Fast loading algorithm loads big data sets
• Print from WellPlot to printers or large format plotters
• Interactive data editing, right on the chart
• On-the-fly calculation of percentage data from currently selected set of taxa
• Improved exaggeration of low abundance taxa
• Pick new events with cap lock down+click
• Filter data with age-depth events file
• Sort by top or base age via age depth filter
• Find feature allows you to add new searches to the previously found set
• Plot abundance values on curve or bar charts
• Reverse Y-axis for measured sections or time scales
Features: *Although the example image links below still show Mac Classic windows, WellPlot 4 is entirely Mac OS X with all OS X features. The example images will be updated to show OS X windows as time permits.
Plot types:
-
X-Y line
-
X-Y lines only
-
Filled polygons (choose fill pattern and color for each column)
-
Butterfly-type polygons
(choose fill pattern and color for each column)
-
Lines or polygons plotted with lines and or circles marking data points
-
Sorted by tops (LADs), bases (FADs), alphabetically or original order from
spreadsheet
-
Bar charts
-
Sorted by tops (LADs), bases (FADs), alphabetically or original order from
spreadsheet
-
Interval histogram range
charts, with user-defined class intervals
-
Total range charts
(solid line plotted from FAD to LAD)
-
Plotted with rectangles
-
Plotted with lines
-
Sorted by tops (LADs), bases (FADs), alphabetically or original order from
spreadsheet
-
Percent events: Tops
(LADs) and bases (FADs) plotted by depth or sample sequence :
-
Cumulative plot of Tops (LADs) and bases (FADs)
-
Histogram of Tops (LADs) and bases (FADs)
-
Scatter plot of Tops (LADs) and bases (FADs)
-
Cumulative plots with
1st derivative
-
Cumulative number of taxa
-
Cumulative abundance
Auto interpret abundances:
-
Similar to lithology interpretation in e-log analysis
-
Set up to 3 cut-off abundances to define up to 4 response type
-
Define color and pattern for 4 resulting divisions
-
Set sample rate
-
Auto-interpreted climate
example
Sort columns in plot by occurrence datums:
-
Tops (LAD)
-
Bases (FAD)
- As entered (original unsorted order)
- Alphabetically
-
Custom events (define event magnitude, i.e. 1 for absolute, 3 for common, etc).
- Species code (taxa with same codes grouped together)
- Sort by increasing maxima
- Decreasing maxima
- Top
age (if LAD provided in age-filter format)
- Base age (if FAD provided in age-filter format)
X-axes:
-
Un-scaled arithmetic
-
Standardized column width; regardless of maximum x value
-
LOG scale
-
Calculate percent or concentration data from currently selected
list of taxa.
-
Rotate taxa names (0, 45, or 90 degrees)
-
Axes scales and labels at top and bottom of chart
-
Float taxa names and taxa codes in windows above the chart window. Taxa names and codes
are now always in clear view.
-
The floating window may be moved to any position over the chart.
-
Control x-axis scale, label increment, and gridlines
-
Exaggeration of low abundance taxa (user defined threshold and factor)
Y-axes:
-
Scaled to depth
-
Sequential samples (for sequential samples without known scale)
-
Sequential sample plots may be scaled by symbol size
Chart scaling:
-
Full control over horizontal and vertical dimensions of chart
-
Create very small or very large wall-sized charts
600 rows by 600 columns:
-
600 X-categories (spreadsheet columns of data)
-
600 Y-samples (spreadsheet rows of data)
-
NOTE: These dimensions can be enlarged to to suit special orders
-
New data loading algorithm loads big data sets lightning fast!
Save charts as PICT file:
- PICT is compatible with nearly every Macintosh application
- Elements of the chart are grouped for easy editing with graphics
applications
- Easily create montages in Canvas, Intaglio, Illustrator or other graphics applications. I recommend Intaglio from (www.purgatorydesign.com/Intaglio/).
- PICT files can be opened in MS-Windows (PC) with Canvas, CorelDraw,
Illustrator and many other Windows graphics applications
Save events:
-
Save FAD and LAD events and possible error ranges in 3 different formats
-
Resulting files may be used with Age/DepthPlot
1.0 * or ShawPlot
1.0 for graphic correlation or RC-RASC
1.0 for ranking and scaling of events.
-
Event files are ASCII text files and may be opened by many applications
on Mac, PC, and UNIX platforms
Save horizons:
-
Horizons may be interactively
picked from the range chart.
-
Horizons can be displayed and plotted on the chart
-
Horizons may be saved to a file for incorporation into a database or other
analyses.
-
Horizon files are ASCII text files and may be opened by many applications
on Mac, PC, and UNIX platforms
Save edited data:
-
Data may be interactively edited on screen in the Interval scaled view
-
Select a sub-set of taxa to save, or save all
-
Save selected set of edited values as a tab-delimited spreadsheet.
Save percentage data:
-
Percentage data is calculated for the currently selected set of taxa
-
Save selected set of percentage values as a tab-delimited spreadsheet.
Save concentration data:
-
Concentration data is calculated for the currently selected set of taxa
-
Entries for markers added, markers counted and sample quantity are required.
-
Save selected set of concentration values as a tab-delimited spreadsheet.
Save list taxa:
- Saves a list of the currently selected set of taxa
Save sums of coded taxa:
- Each taxa may be assigned a code
- Taxa with the same codes are summed
- Sums of groups are saved as a new spreadsheet
- Summary spreadsheet files are ASCII text files and may be opened by many applications on Mac, PC, and UNIX platform
Save diversity (richness) of coded taxa:
- Each taxa may be assigned a code
- The diversity (richness) of taxa with the same codes are summed
- Diversity of groups are saved as a new spreadsheet
- Summary spreadsheet files are ASCII text files and may be opened by many applications on Mac, PC, and UNIX platform
Save transfer function sums of coded taxa:
- Each taxa may be assigned a code
- Transfer functions are calculated based on the taxa codes
- Sums of groups and final transfer result are saved as a new spreadsheet
- Summary spreadsheet files are ASCII text files and may be opened by many applications on Mac, PC, and UNIX platform
Interactive information:
- In the interval chart view the following information is displayed at the
position of the mouse cursor: depth (sample name), taxa name, and abundance
-
In the other views, only depth is displayed
-
Multiple taxa may be copied to the clipboard with this feature and looked-up in a database.
-
Edit data and taxa directly within WellPlot
-
Save edited data sets as spreadsheet data files
Color and pattern:
-
Each taxa may be assigned a color and pattern
-
Color example (reduced
in size for the web)
Miscellaneous:
-
Taxa names may be displayed in a floating
window anywhere on the chart
-
Taxa codes may also be displayed in a floating window anywhere on the chart
-
Taxa and depth located with mouse (point and click for information)
-
Save separate color table files (assign colors to similar data sets)
-
Horizontal gridlines spanning chart
-
Variable symbol size and bar thickness
-
Hairline to 2 point line weights
-
Draw temporary lines and rectangle with the mouse
-
On-line help screen
-
Chart and data summary information display
- Comment lines in the data file must be preceded by the "#" symbol.
-
All output and input
data files are cross-platform ASCII text files and may be opened by
many applications on Mac, PC, and UNIX platforms
- New data loading algorithm loads big data sets lightning fast! Faster
than Excel!
NOTE: Although charts may be printed directly from WellPlot,
the full power of the this software package is realized when multiple
diagrams are assembled in a montage in a graphics application. The recommended graphics application is Intaglio from www.purgatorydesign.com/Intaglio/.
*Age-Depth Plot is no longer for
sale. Services are available from
biostratigraphy.com.
|

 WellPlot
4 for
Mac OS X 10.6.8 or earlier
WellPlot
4 for
Mac OS X 10.6.8 or earlier 