| Normalizes and plots 3 values on a triangular diagram and component
cross-plots
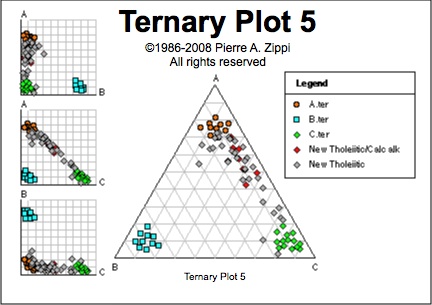
Ternary Plot is an analytical and plotting application that normalizes
and plots three values on a triangular diagram and 3 bivariate cross-plots. Means and standard deviations are calculated in the normalized space. Negative
values may be projected outside the triangular system.
Version 5 for Mac OSX (Intel & PPC Macintosh computers)
Ternary Plot documents : Open multiple data sets and save all in one Ternary Plot document. Documents can also be used to save styles (gridline color, increment, chart size, font, etc.) by saving a chart without data.
Bivariate cross-plots: Three bivariate cross-plots (AB, AC, BC) may be displayed next to the triangular diagram.
Selectable data sets: Up to 50 individual data sets may
be plotted on a single chart. Plot characteristics for any data set may be changed or deleted at
any time.
Automatic legend: Symbols and data set names are automatically
placed into a legend. Data set names may be edited at anytime. Data sets may be selected from the legend.
Statistics: Means and standard deviations are calculated
and plotted for each data set.
Full color: Select from the full palette of colors for
symbols and grid lines.
Also: Six standard diagram sizes, built-in help, full font
type menu, and much more.
Program description:
Data entry:
Ternary Plot 5 has a simple data entry module, however,
a word processor or spreadsheet application is recommended for manual data entry.
1) Text files:
Data may be read into Ternary Plot from ordinary 3-column tab-delimited
text files. Text files should be organized with samples as rows and components
(A,B,C) in 3 columns. Save data files with 3 columns as tab or comma delimited
text files.
2) Clipboard data entry:
Numerous comparisons of data from spreadsheets may be made by using
the data input from clipboard option. Copy any selection of three
columns from a spreadsheet or text document and switch to Ternary Plot
5. To plot the data contained in the clipboard, click the mouse
inside the triangle (or any white space not containing text) and select
Paste from the Edit menu. Select and copy different segments
of data then plot with different symbols for comparison.
3) Enter data interactively:
Data may be created interactively by clicking the mouse pointer within
the triangular area. Select Interactive data from the Ternary options menu. Each click of the mouse within the triangular area will generate
a data point. Select Interactive data again to turn-off the data
acquistion feature and uncheck the menu item. Select Save interactive
data from the File menu if you wish to save the data set.
Data format (import format):
#Comment lines (lines starting with "#" are
ignored)
A * B * C¶ (optional labels must be non-numeric)
10 * 15 * 3
25 * 20 * 5
32 * 22 * 7
187 * 125 * 68
177 * 138 * 100
355 * 234 * 125¶ (where * = tab or comma delimiter)
The values may be decimal or integer.
The data must be saved as TEXT.
Do not use the measurement unit symbols in the data.
Data comments:
Lines containing comments must start with the "#" symbol. During data
loading comments are ignored. Comment line must be the first lines encountered and occur above the actual data.
Capacity (file size):
TernaryPlot 5 can process data files with up to 10,000 lines of data (points).
Fifty data sets may be opened and plotted on the same diagram.
If you need to analyze more than 10,000 measurements or 50 data sets
in one diagram, contact the author for free program modification.
Save:
TernaryPlot 5 can save PICT images that can be opened and edited by graphics applications. Ternary Plot documents can save up to 50 different datasets in a single document.
Print:
TernaryPlot 5 can print color or black & white diagrams. Diagrams can be saved as PDF documents via the print dialog. PDF files can also be edited with graphics applications.
Edit menu:
Copy and paste: When an edit field is active, the copy
and paste commands will function with the text in the edit fields. Click
in the white space outside an edit field (or press "return" or "enter")
to de-activate the edit fields and activate the graphics. With edit fields
de-activated, the copy command will copy the ternary plot chart to the
clipboard as a PICT graphic and the paste command will plot values contained
in the clipboard as a new data set.
Clear (delete) a data set: Selecting Clear from the Edit
menu will delete the active data set. A bullet to the right of the
data set name in the legend marks the active data set. Typically
the last data set is the active data set. The active data set is
also marked with a check in the Data sets menu. Make any data
set active by clicking the data set name in the legend. Selecting
a data set from the data sets menu will make that data set active and cause
the Symbols dialog to open.
Plotting negative values:
Negative values may be trapped as errors, or plotted (projected) outside
the triangular diagram. To plot negative values outside the triangular
boundary, select Plot negative values from the Ternary options menu. When the menu item is unchecked negative values are trapped
as data entry errors, ignored and not plotted.
Apex factors:
An apex factor option allows the application of a multiplier to any
component before normalization.
Associated X-Y plots:
X-Y cross-plots of normalized A-B, A-C and B-C may be displayed
along side the ternary diagram. Because the values are normalized, plotted
points will never cross into the upper right half of the x-y charts.
Statistics:
The mean, mean with error bars, and a standard deviation hexagon may
be displayed for each data set. The six error bars are plotted as the mean ± 1 standard deviation of one component. The standard deviation
hexagon is plotted as the mean ± various combinations of 1 standard
deviation for each component. Note: the variance is calculated with
N(N-1) in the denominator.
Chart Scaling:
Six chart sizes are available. Use the smaller chart sizes when plotting
negative values.
Output:
Diagrams can be saved as PICT files or transferred via the
clipboard to almost any other application. Text and graphic elements
of the diagram can be edited with any draw-type application (e.g. Intaglio, Illustrator, Canvas, etc).
TernaryPlot 5 creates PICT output.
Copy the diagram to the clipboard, using 'Copy' from the Edit menu,
Paste into graphics applications, or any other application.
Save the diagram as
a PICT document.
The diagram may be completely edited with a vector graphics application.
Intaglio is the preferred PICT editor.
Each element of the diagram is a discrete object.
In general, similar items are grouped:
Data points for each data set are grouped, grid lines are grouped.
All may be ungrouped in any graphics application.
Changes may be made to font size and style, line thickness, color, fill
pattern, pen pattern, etc.
System requirements: Mac OSX 10.6.8 or earlier and PPC or Intel Macintosh computer.

Price: $150
Pierre A. Zippi
7518 Twin Oaks Court
Garland, Texas 75044
email: paz@pazsoftware.com
Features:
Save as graphics as PICT documents
Save data as TEXT files.
Automatic legends
Tick marks and grid lines
Apex factors are multipliers that are applied to the data before normalization.
Use the apex factors to standardize data of differing units. (Quickly change
percent to parts per thousand by using a factor of 0.1).
Interactive data acquistion: point and click the mouse within the triangular
area to create a normalized data set.
Plot or trap negative values. Negative values may be trapped as errors
or projected outside the triangular diagram.
|