
 LogPlot
5 for Mac OS X (Intel & PPC Macs)
LogPlot
5 for Mac OS X (Intel & PPC Macs) Plot curves (e-logs) against depth
 LogPlot
5 plots up to 10 columns (logs) against a common depth.
Data is read directly from ASCII text data (spreadsheets) or extracted from LAS files. Plot types include:
x-y points, x-y line plots (log style), bar charts (log style), max-min, and cumulative plots.
The Y-axis (depth) can be scaled to meters or feet. The X-axis
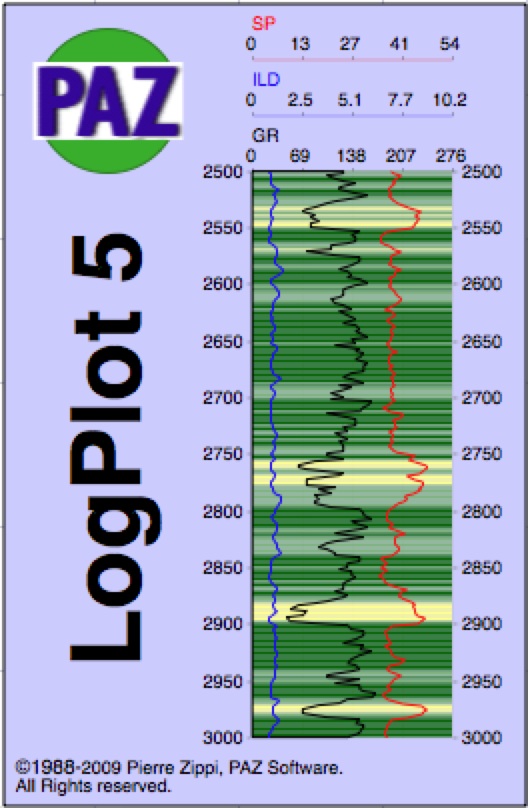
can be normal (arithmetic), reverved or LOG scale. X-values can be plotted in assigned tracks, and interpreted with color filled intervals. The charts can be scaled to any
horizontal and vertical dimension. See the small example chart in JPG format with 7 curves in 3 tracks. The chart may be copied or saved as a vector PICT file that can be edited with Intaglio, Illustrator or any other vector graphics application. Multiple charts can be assembleld into a montage in any graphics application. LogPlot
5 plots up to 10 columns (logs) against a common depth.
Data is read directly from ASCII text data (spreadsheets) or extracted from LAS files. Plot types include:
x-y points, x-y line plots (log style), bar charts (log style), max-min, and cumulative plots.
The Y-axis (depth) can be scaled to meters or feet. The X-axis
can be normal (arithmetic), reverved or LOG scale. X-values can be plotted in assigned tracks, and interpreted with color filled intervals. The charts can be scaled to any
horizontal and vertical dimension. See the small example chart in JPG format with 7 curves in 3 tracks. The chart may be copied or saved as a vector PICT file that can be edited with Intaglio, Illustrator or any other vector graphics application. Multiple charts can be assembleld into a montage in any graphics application. LAS data files may be converted using LAS-DataSampler (included). Features:
Diagrams may be saved as a PICT files for inclusion into larger montages with
range charts from WellPlot and tadpole plots from Dipmeter. |
| Easy operation
Open a tab-delimited ASCII TEXT file that contains the data. The data must be organized into at least two columns as follows: Y[tab]X1[tab]X2[tab]X3[tab]X4[tab]X5[tab]X6[tab]X7[tab]X8[return]; The first column must contain the Y-axis values. Depth should be positive
values.
If the original data file is too large to be opened or parsed with Excel, etc., then use LAS-DataSampler (included) to convert and sample the original the LAS or ASCII file at specified intervals and create a smaller, more manageable data file. LAS-DataSampler was developed so that desktop computers can read and plot geological e-log data at normal scales of presentation. Functions: |
![]()
email: paz@pazsoftware.com
Functions: