LAS-DataSampler 4 reads Log ASCII Standard
(LAS) files and converts the data into tab or comma delimited spreadsheets. The data may be sub-sampled at specified intervals to create smaller and more manageable elog data files for use on any computer platform.
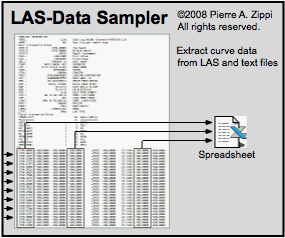 LAS-DataSampler reads the log header information to find the number of curves in the file. You select
the curves you want to save and LAS-DataSampler will sub-sample the original
data file at specified intervals and parse the selected curve data into
delimited (columns) fields. LAS-DataSampler reads the log header information to find the number of curves in the file. You select
the curves you want to save and LAS-DataSampler will sub-sample the original
data file at specified intervals and parse the selected curve data into
delimited (columns) fields.
The resulting file may be used in software on a Mac or PC.
LAS-DataSampler will also reduce the size of large ASCII
TEXT data files.
LAS-DataSampler 4 was developed so that standard Macintosh
software could read and plot geological e-log data at normal scales of
presentation. The application runs on any Macintosh computer, but the converted
data files may be used on any platform including DOS, Windows and Unix.
Use LogPlot 4.0 to plot the elog data and
save the resulting charts as PICT file that may be opened and printed by
any Macintosh application. The charts are completely editable in graphics
applications such as Canvas, ClarisDraw, MacDraw, Adobe Illustrator, etc.
Description:
Logging tools typically record many times the number of data points
necessary for common presentation and display purposes. Gamma-ray log of
bore holes are commonly sampled every 6 inches. Thus, e-logs for a typical
10,000 foot drill hole consist of 20,000 data points. Most personal computers
and associated software cannot read or plot 20,000 (non-integer) data points.
LAS-DataSampler may be used to sub-sample the original curve data. For
example, sampling 1 out of every 10 lines of the original file would create
a new data file with 2000 lines of data (or samples every 5 feet).
The new file will:
have ample resolution for display purposes at normal presentation
scales, be re-formatted into a tab or comma delimited ASCII
text spreadsheet
load and parse faster in Excel and plotting software
be able to be plotted with many Mac and PC software applications.
Charts and graphs made with the new files will:
plot faster and scroll faster in LogPlot 4.0 or other plotting software
copy, paste or open faster in Intaglio, Canvas, Adobe Illustrator,
etc.
print faster, etc.
Use this application to reduce the sample interval to reflect your needs.
Don't waste time with sample resolution far
beyond the printer resolution.
Many software applications plot a limited number of samples. For example,
Excel will only plot a limited number of data points.
Features:
Choose depth range
Pick curves to save
Set sample interval
Skip (or save) header information not required by analysis software.
Skip portions of data set
Skip blank lines or lines shorter that a specified length.
Choose tab or comma delimited.
Save comments option (such as Well name, null value, LAS version, etc.)
Save null values or leave nulls blank
Data input:
LAS-DataSampler 4 reads data saved as ASCII text or LAS versions 1.0
or 2.0
Data output:
LAS-DataSampler 4 writes data output as standard tab or comma delimited
ASCII text files in a standard spreadsheet format.
|