Utilizes the computer keyboard
and mouse as an expanded differential counter.
|
Counter 4.5 is data acquisition and quality control software that emulates an expanded manual mechanical counter. Try the trial version free for 15 days. If you like it, send payment and a registration key will be emailed within 24 hour (holidays excepted). Keep in mind, the unlocked version has no limit on the number of samples or categories. Count anything. Use it to do differential cell counts in a clinical laboratory. Existing
users count: cells, pollen, spores, mold, algae, palynology, diatoms, blood cells,
auto traffic, minerals, petrography, ASTM concrete specs, microfossils,
foraminifera, nannofossils, radiolaria, conodonts, trees, plants, etc.
New features in Counter 4.5: System requirements: Download 15-day limited*
Trial version 4.5.4 (96) 8.23.2011 |
Single copy price: $150 USD.
Volume pricing / site licensing. |
|||
Number of |
Price per |
Purchase |
Upgrade |
licenses |
additional license |
Total purchase price |
Total upgrade price |
1 |
$150 |
$150 |
$75 |
2 |
$125 |
$275 |
$140 |
3 |
$100 |
$375 |
$190 |
4 |
$75 |
$450 |
$225 |
5 |
$50 |
$500 |
$250 |
6 |
$50 |
$550 |
$275 |
Each additional license after 5 is $50 per license. |
|||
Other payment options
Pierre A. Zippi
7518 Twin Oaks Court
Garland, Texas 75044
![]()
email: paz@pazsoftware.com
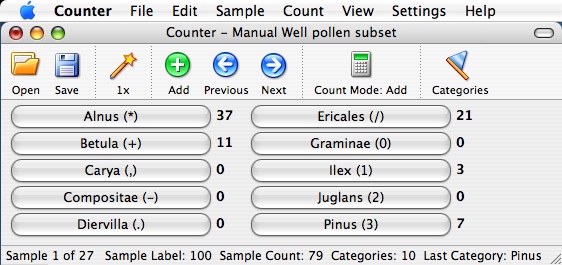
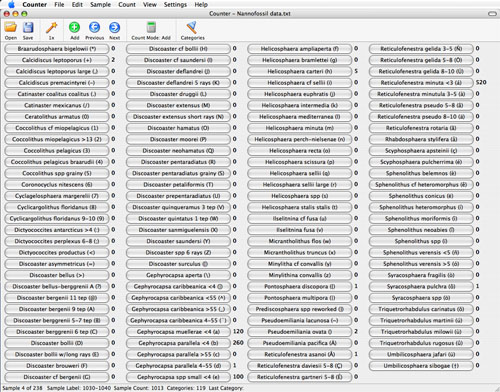
Mac screen
shot of Button view below. Click button or press key to count.
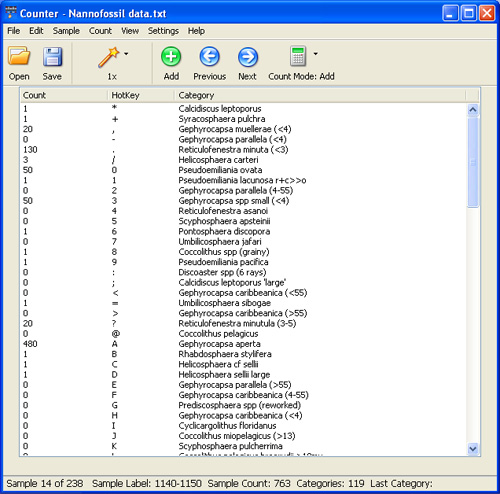
Windows
XP Pro screen shot of List view below. Click line item or press key to count.
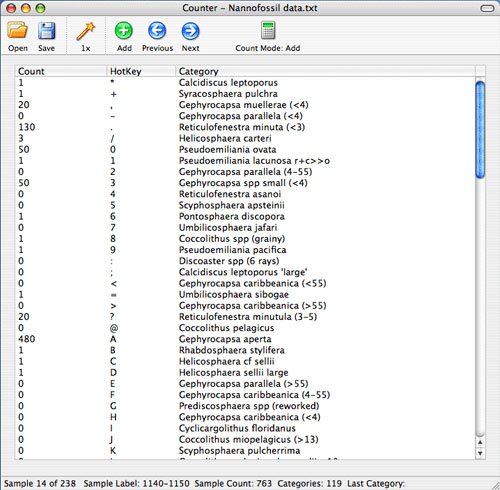
Mac OSX screen shot of List view
below:
Mac OSX screen shot of Button
view with lots of categories below:
Coming soon in next version:
Histograms and data growth charts provide built in quality control that ensures the best
balance between statistical validity and the time taken to collect the data.
At any time during the data collection process, a histogram and a growth chart may be
displayed to monitor data development.
Counter 4.5 for
Windows and MacOS X (PPC & Intel), and Linux on request.
Check out WellPlot
4 a Mac OS X application to plot many columns of data on the same chart.